Modern Trading Challenges
Today's traders face unprecedented challenges:
- ✔ Markets generate millions of data points every minute
- ✔ Human cognition cannot process this volume of information
- ✔ Traditional indicators produce conflicting signals
- ✔ Emotional decision-making undermines rational analysis
- ✔ Preparation and analysis consume hours of valuable time
Market Reality:
These challenges explain why only a small percentage of traders achieve consistent profitability. The human mind, despite its pattern recognition abilities, simply cannot compete with the complexity of modern markets.

The Solution: DeltaPredict's Algorithmic Framework
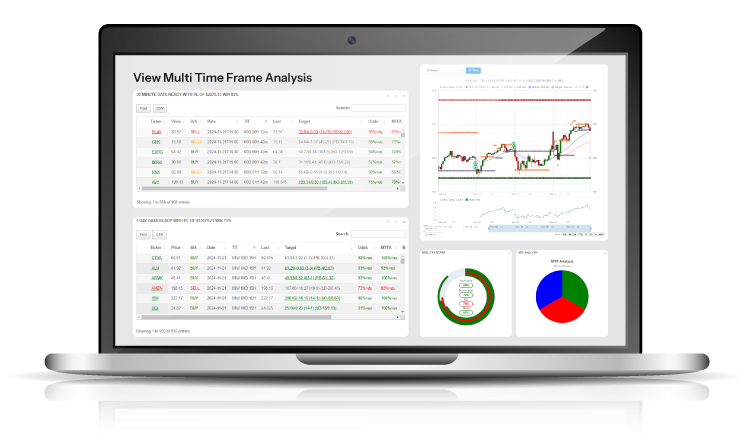
DeltaPredict transforms trading by applying quantitative science to market analysis:
"We designed DeltaPredict to bridge the gap between sophisticated institutional algorithmic trading and the individual trader. Our system processes millions of market data points through proprietary MTFA algorithm, then presents only the most statistically significant patterns in an intuitive DeltaSPZEN Dashboard."
The 5-Step Scientific Method: How DeltaPredict Works
DeltaPredict's core functionality follows a systematic 5-step process that converts overwhelming market data into clear, actionable trading decisions:
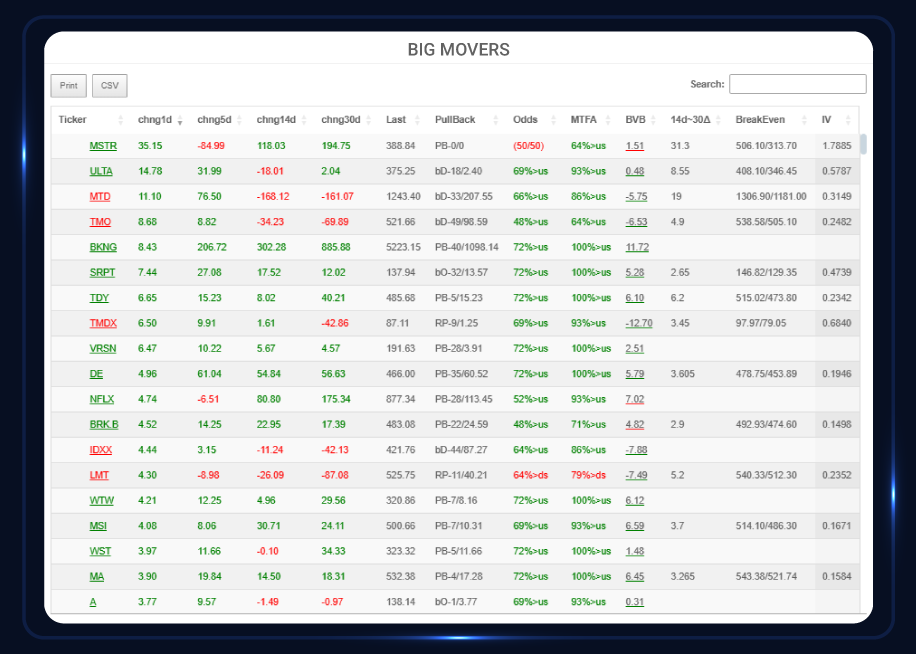
BEGIN WITH BIG MOVERS — Volatility Detection Algorithms
Key Benefit: Eliminate hours of unproductive scanning and focus only on stocks with statistical significance.
What it does:Instantly identifies stocks exhibiting statistically significant price movement across the entire S&P 500.
The science behind it: The system calculates standard deviation expansions across multiple timeframes (1-day, 5-day, 14-day), identifying assets exhibiting abnormal volatility relative to their own historical patterns.
The volatility detection dashboard includes
Big Mover Identification
Automatically scans the entire market to highlight stocks with unusual price movement. Focuses your attention on assets experiencing significant institutional capital flow.
Multi-Timeframe Volatility Analysis
Analyzes price action across daily, weekly, and monthly timeframes to identify stocks with expanding volatility profiles that often precede major moves.
Statistical Significance Filtering
Applies rigorous statistical thresholds to eliminate random noise. Only displays stocks with movement that exceeds 95% confidence intervals.
Real-Time Opportunity Alerts
Continuously monitors the market for emerging volatility patterns, ensuring you never miss a high-potential setup as it develops.
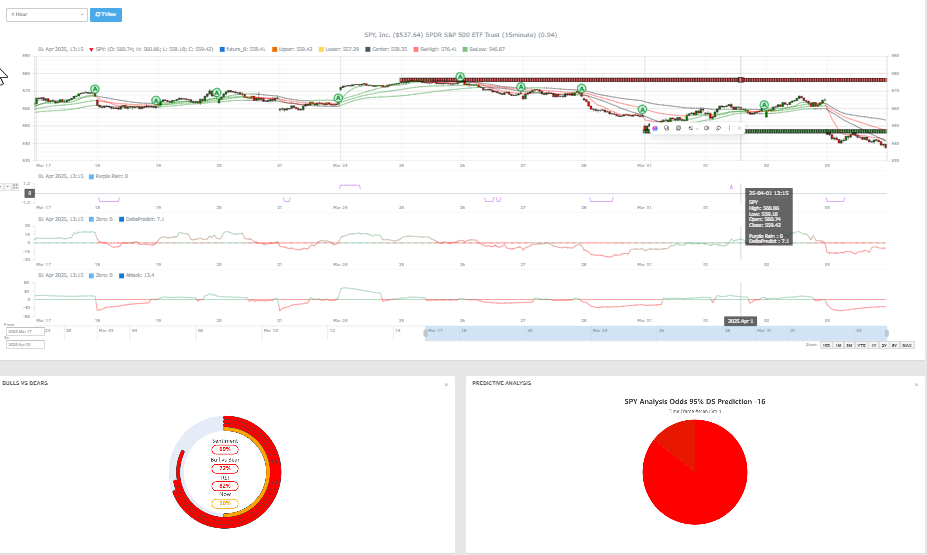
APPLY SURGICAL DRILL DOWN FILTERS — Multivariate Pattern Recognition
Key Benefit: Stack multiple filters to create exponentially powerful combinations that isolate only the highest probability setups among thousands of possibilities.
What it does: Applies sophisticated filtering algorithms to isolate specific market conditions with proven statistical edges.
The science behind it:Multiple proprietary algorithms analyze trend strength, momentum shifts, volatility expansion, and price velocity simultaneously, creating powerful intersections of high-probability conditions.
The filtering ecosystem includes:
Purple Rain Algorithm
Identifies statistically significant trends by analyzing price action relative to adaptive moving averages and volume characteristics. Bright purple indicates strong institutional buying, while deep magenta reveals smart money distribution.
Attack Momentum Detection
Identifies the precise volatility expansion pattern preceding potential breakouts, based on proprietary oscillator calculations of buying and selling pressure accumulation.
DP Cross Signal Analysis
Detects fresh momentum signals through time-series analysis of buying pressure indicators, highlighting specific crossover events that have been back-tested for statistical significance.
Dynamic F8 & SD Bands
Calculates adaptive support/resistance zones that automatically adjust to each stock's unique volatility profile, providing mathematically precise reversal zones.
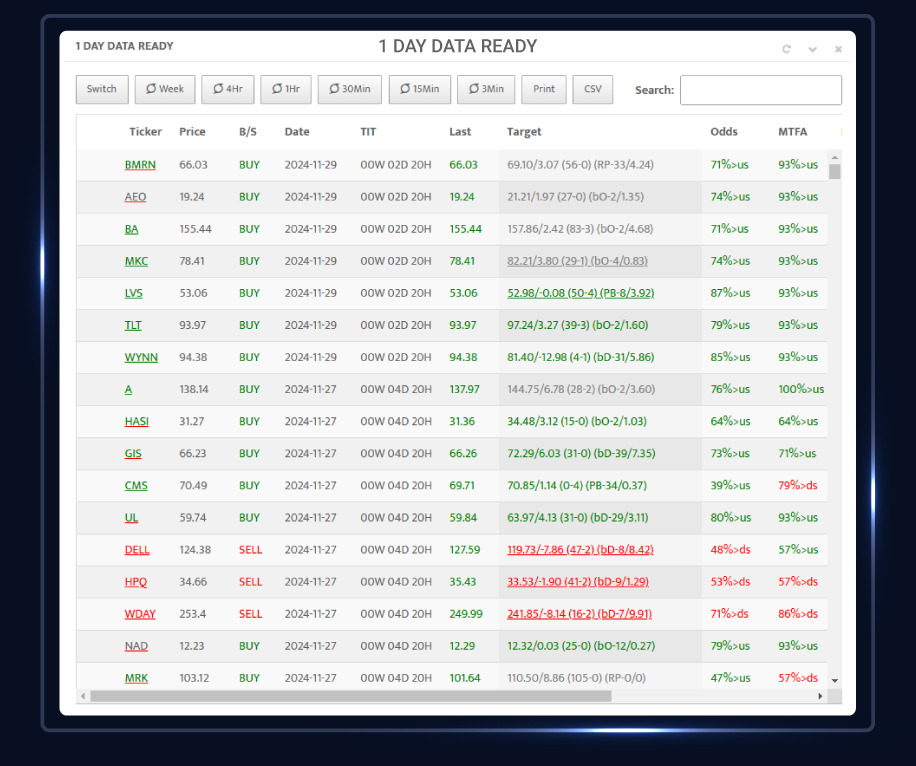
REVIEW THE DATA TABLE — Statistical Probability Modeling
Key Benefit: Replace subjective judgment with objective statistical analysis, knowing the mathematical edge of each potential trade before capital is deployed.
What it does: Presents precise statistical analysis of each trading opportunity, including probability of success, targets, and optimal risk parameters.
The science behind it:Machine learning algorithms analyze thousands of historical patterns matching current market conditions, calculating.
The analysis dashboard includes:
Probability Odds Calculator
Displays precise statistical edge for each setup based on 10+ years of historical pattern performance. Green odds ≥95% highlight exceptional opportunities with mathematically verified advantages.
Target Precision System
Generates mathematically calculated price targets using volatility metrics and supply/demand algorithms. Eliminates guesswork by providing exact price levels for profit-taking.
Risk-Optimized Position Sizing
Calculates ideal position size based on account parameters, volatility profile, and statistical edge. Ensures consistent risk management across all trades.
ROI Projection Analytics
Combines target distance and probability metrics to calculate expected value for each setup. Enables rapid comparison of opportunities based on mathematical expectancy.
CONFIRM MULTI-TIMEFRAME ALIGNMENT — Drill Down Analysis

Key Benefit: Eliminate false signals by confirming that patterns are valid across multiple time dimensions, providing mathematical validation of pattern significance.
What it does: Verifies pattern consistency across multiple timeframes to confirm signal validity.
The science behind it:The Drill Down table displays comprehensive analysis of your chosen stock across all relevant timeframes (3-minute, 15-minute, 1-hour, 4-hour and daily charts), showing current price, target price, probability odds, and indicator status for each timeframe.
The multi-timeframe dashboard includes:
Timeframe Correlation Matrix
Displays signal strength across all critical timeframes in a unified view. Green highlights show perfect alignment, while red indicates conflicting signals requiring caution or avoidance
Institutional Flow Detection
Identifies whether large players are accumulating or distributing across different time horizons. Reveals hidden smart money activity that retail traders typically miss.
Precision Target Projection
Calculates mathematically precise price targets for each timeframe based on volatility measurements and historical price behavior at similar market junctures.
Momentum Strength Indicator
Quantifies the power behind each price move with proprietary algorithms. Higher readings indicate stronger institutional participation and higher probability outcomes.
EXECUTE WITH PRECISION — Algorithmic Position Management
Key Benefit: Execute trades with mathematical precision, removing emotional decision-making and replacing it with data-driven position management.
What it does:Provides exact entry points, profit targets, and stop-loss levels based on each stock's unique volatility fingerprint.
The science behind it:Dynamic F8 and Standard Deviation Bands calculate optimal position parameters based on:
Purple Rain
Identifies the prevailing trend direction with institutional-grade clarity, eliminating countertrend errors that plague most traders.
DeltaPredict Momentum Timing
Precisely times entries and exits by exposing hidden buying/selling pressure at key turning points, capturing optimal entry and exit zones.
Attack Validation
Confirms explosive price potential at entry, ensuring trades are executed when directional force reaches optimal intensity.
Dynamic Band Position Sizing
Determines appropriate position size and risk parameters based on each setup's statistical profile and volatility characteristics.
Quantifiable Results: The Power of Algorithmic Trading
Independent verification of DeltaPredict's methodology shows consistent outperformance:
Time Efficiency
Complete market analysis in under 5 minutes vs. traditional 3+ hours
Accuracy Improvement
Back-testing shows 80%+ success rate on high-probability setups vs. industry average of 38-42%
Risk Management
DeltaPredict delivers precise entry/exit targets enabling streamlined risk management with clearly defined parameters for optimal position sizing.
Psychological Advantage
Significantly reduced emotional decision-making through systematic approach
How DeltaPredict Transforms Trading Performance
DeltaPredict's algorithmic framework delivers four critical advantages:
Finding Clarity in Market Chaos
Instantly identify high-potential opportunities hidden within market randomness.
PRICE
Stacking Multiple Edges: Combine algorithmic filters to create exponentially powerful probability models
Visualizing Complex Data
Color-coded tables and charts transform sophisticated mathematical calculations into intuitive visual representations for instant pattern recognition.
Removing Emotional Bias
Replace subjective judgment with objective statistical analysis
Experience Algorithmic Trading Without a Mathematics Degree
DeltaPredict labs represents years of quantitative research distilled into an intuitive interface that anyone can master—regardless of mathematical background.
For a limited time, paid subscribers receive our "DeltaPredict Quantitative Edge" video series ($497 value) absolutely FREE—explaining the mathematical principles behind each component of the DeltaPredict system.
Where institutional-grade quantitative analysis meets intuitive design—transforming how you analyze and trade the markets.
Ready to Transform Your Trading?
Experience the power of DeltaPredict's revolutionary technology with our 7-day free trial.
Sign Up Free Contact Us